
Written by the Mackenzie Fixed Income Team
Key Highlights
- The potential 10% universal tariff on all imported goods could start as early as April 1st, leading to higher inflation and nominal GDP growth in the US.
- Canadian assets and currency face significant risks, with a 10% tariff on Canadian goods potentially reducing Canada's real GDP by approximately 1% in the first year.
- The Bank of Canada has cut rates by 200 basis points, bringing the policy rate to 3%, with future decisions likely influenced by US tariff policies. The 30-year U.S.–Canada yield gap is around 150 basis points, indicating a significant economic divergence, though a re-narrowing is expected.
- Our key active hedging inflation risk with inflation-linked bonds and focusing on high-interest rate sensitive countries like Canada and New Zealand, while capturing emerging market opportunities.
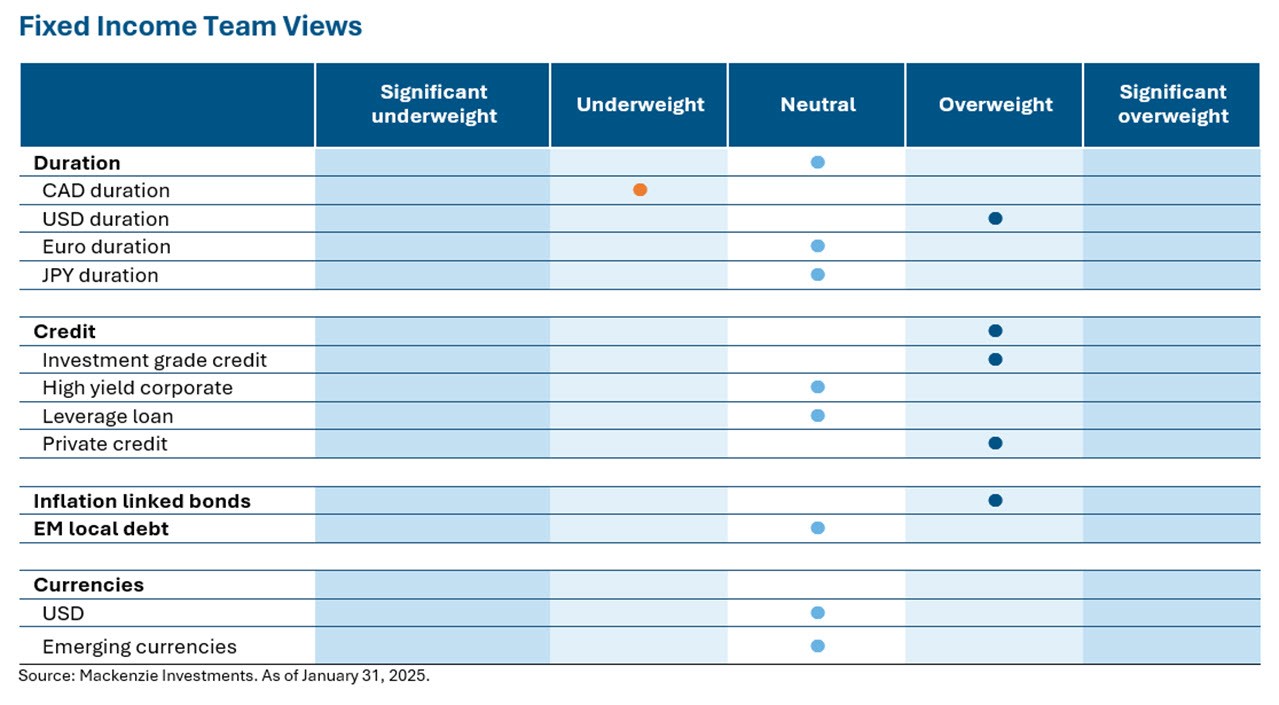
Duration and Curve Positioning
Tariffs continued to remain the focus centre in 2025 among market participants. We see an increasing likelihood of a 10% universal tariff on all imported goods to the US, which could start as early as April 1st as a strategy to generate revenue to offset proposed tax cuts. The potential universal tariff could lead to higher inflation and nominal GDP growth, which aligns with Trump's goal of stimulating the economy. A 10% across-the-board tariff on Canadian goods could potentially reduce Canada's real GDP by approximately 1% in the first year. Notably, the 30-year U.S.–Canada yield gap stands at around 150 basis points suggesting a fundamental difference between the two economies. We find the wider spread to be rare and usually short-lived for their long-term economic paths to diverge so dramatically. We believe in a re-narrowing of the gap in the 30 year bond yields, and growth expectations snapping back closer together.
Bank of Canada has now implemented 200 basis point of rate cuts since the cycle peak bringing policy rate to 3%, below its neutral rate range of 2.75%-3.25%. We expect bank’s future rate decisions to depend on US policies particularly regarding tariffs with a skew towards more rate cuts and a stronger CAD this year. Our active macro trade therefore is hedging out the inflation risk by being overweight inflation linked bonds in our global portfolios. We believe the risk of incremental divergence in monetary policies is a function of structural country specific differences. High-interest rate sensitive countries like Canada, New Zealand may need deeper rate cuts than currently anticipated and therefore have an overweight allocation in our portfolio. Our diverse toolkit allows us to capture emerging market opportunities, with our open position in Indonesia being a key alpha driver. Identifying discrepancies between market pricing and expectations is a fundamental part of our selection process.
The economic outlook for 2025 is complex, and we continue to assess the attractiveness of the all-in yield given tight credit spreads in the high yield space. A constructive outlook is supported by the change in US leadership, but active management and a conservative approach are crucial for achieving above-average returns.
Central Bank Watch
US Fed (Fed)
South of the border, US Fed kept rates unchanged as expected at 4.25%-4.5%, however a key decision was the removal of forward guidance on interest rates. This change may signal end of the bank’s easing cycle, influenced by the strength of the US economy. In the meeting Fed Governor mentioned the Fed officials were in no rush to lower interest rates, as a sign of a more cautious approach as the bank seeks to gauge where inflation is headed.
Bank of Canada (BoC)
The Bank of Canada (BoC) continued its policy rate easing but at a slower pace, implementing a 0.25% rate cut. This adjustment brings the policy rate to 3%, which is below the neutral range of 2.25-3.25%. As widely expected, potential shocks from Tariffs have led to major uncertainty and is also reflected in the weaker CAD vs USD. We feel the governor may look trough tariff induced inflation in favor of excess supply in the economy and a softer labor market leading to a policy rate near the lower end of the neutral range for the cycle.
European Central Bank (ECB)
The European Central Bank reduced its key rates by another 25 basis points to 2.75% as the region's inflation continues to develop broadly in line with expectations and the upward pressure on domestic inflation from strong wage growth is abating. The governing council said the bloc's inflation rate is expected to reach its 2% medium-term target within 2025. The euro area's annual inflation was 2.4% in December 2024, accelerating from 2.2% in November.
Bank of Japan (BoJ)
Japan’s central bank rose rates by 0.25% to 0.50%, highest in 17 years as it tries to curb rising prices. The officials also substantially revised the inflation expectations higher by 0.50% to 2.4%, highlighting the need to maintain the direction of rate hikes if the outlook was realized. The Governor didn’t provide much clarity on the pace of additional hikes or the terminate rate of the cycle however he did mention that the current rate is far from neutral, which the market believes is 1%.
Emerging Markets (EM)
Despite recent gains, the outlook for EM local currency debt remains uncertain due to US tariff risks, which may keep US rates high and the USD strong. EM local market performance has improved since mid-January as core rates retraced from earlier highs and USD appreciation faded. However, these gains are vulnerable to tariff developments. These developments could support the USD and US Treasury yields, weighing on EM market confidence and performance. Elevated US rates, elevated risk premia, US policy uncertainty could limit appetite for EM local debt. In 2025, investment in EM debt is likely to be more selective, with a preference for markets that are more resilient or less correlated to tariff-related risk aversion, though yield pick-up will also be a factor
Credit Market Performance
Investment Grade Credit (IG)
Corporate bond yields in the US softened marginally, while yields in Canada fell sharply, driven by the domestic rate market and a recent rate cut. Specifically, US investment-grade (IG) bond yields decreased by 7 basis points to 5.29%, resulting in a monthly return of +0.60%. In contrast, Canadian IG bond yields dropped by 17 basis points to 4%, with a monthly return of +0.98%. We continue to find value in and prefer our exposure to the front end of the Canadian corporate bond market.
High Yield Bonds (HY)
The HY index provided a +1.4% gain in January with CCCs (+1.82%) outperforming Single Bs (+1.55%) and BBs (+1.38%). High-yield bond spreads tightened 30 bp in January as the asset class benefited from a rebound in equities, below average issuance, a resumption of retail inflows, and positive macro signals emanating from a benign start to earnings season.
Leveraged Loans (LL)
The LSTA US Leveraged Loan Index gained 0.69% in January contributed substantially from coupon clipping. Secondary loan prices rallied by 28 bps in January as net supply continues to lag robust investor demand, bringing the weighted average bid of the index to 97.61 and index yield at 8.37% vs. 9.5% in Sep’24. Higher-rated names have underperformed so far in 2025. BB rated loans, which account for roughly 20% of the index, gained 0.66%, a tick below the 0.67% return for B rated, which accounts for 63% of all outstanding loans. The riskiest CCC rated loan outperformed with a return of 0.96%.
Commissions, trailing commissions, management fees, and expenses all may be associated with mutual fund investments. Please read the prospectus before investing. The indicated rates of return are the historical annual compounded total returns as of January 31, 2025, including changes in share value and reinvestment of all distributions and does not take into account sales, redemption, distribution, or optional charges or income taxes payable by any security holder that would have reduced returns. Mutual funds are not guaranteed, their values change frequently, and past performance may not be repeated. Index performance does not include the impact of fees, commissions, and expenses that would be payable by investors in the investment products that seek to track an index.
Index performance does not include the impact of fees, commissions, and expenses that would be payable by investors in investment products that seek to track an index.
This document may contain forward-looking information which reflect our or third party current expectations or forecasts of future events. Forward-looking information is inherently subject to, among other things, risks, uncertainties and assumptions that could cause actual results to differ materially from those expressed herein. These risks, uncertainties and assumptions include, without limitation, general economic, political and market factors, interest and foreign exchange rates, the volatility of equity and capital markets, business competition, technological change, changes in government regulations, changes in tax laws, unexpected judicial or regulatory proceedings and catastrophic events. Please consider these and other factors carefully and not place undue reliance on forward-looking information. The forward-looking information contained herein is current only as of January 31, 2025. There should be no expectation that such information will in all circumstances be updated, supplemented or revised whether as a result of new information, changing circumstances, future events or otherwise.
The content of this commentary (including facts, views, opinions, recommendations, descriptions of or references to, products or securities) is not to be used or construed as investment advice, as an offer to sell or the solicitation of an offer to buy, or an endorsement, recommendation or sponsorship of any entity or security cited. Although we endeavour to ensure its accuracy and completeness, we assume no responsibility for any reliance upon it.
All information is historical and not indicative of future results. Current performance may be lower or higher than the quoted past performance, which cannot guarantee results. Share price, principal value, and return will vary, and you may have a gain or a loss when you sell your shares. Performance assumes reinvestment of distributions and does not account for taxes. Performance may not reflect any expense limitation or subsidies currently in effect. Short-term trading fees may apply.
This material is for informational and educational purposes only. It is not a recommendation of any specific investment product, strategy, or decision, and is not intended to suggest taking or refraining from any course of action. It is not intended to address the needs, circumstances, and objectives of any specific investor. Mackenzie Investments, which earns fees when clients select its products and services, is not offering impartial advice in a fiduciary capacity in providing this sales and marketing material. This information is not meant as tax or legal advice. Investors should consult a professional advisor before making investment and financial decisions and for more information on tax rules and other laws, which are complex and subject to change.
The rate of return is used only to illustrate the effects of the compound growth rate and is not intended to reflect future values of the mutual fund or returns on investment in the mutual fund.